The whole team at a glance.
The utility's owner or sales manager sees everyone working on the leads, internal staff or external agents alike: where each lead stands, why deals are lost, what each person does, and what the proposals are worth.
Step by step, in the platform.
-
01
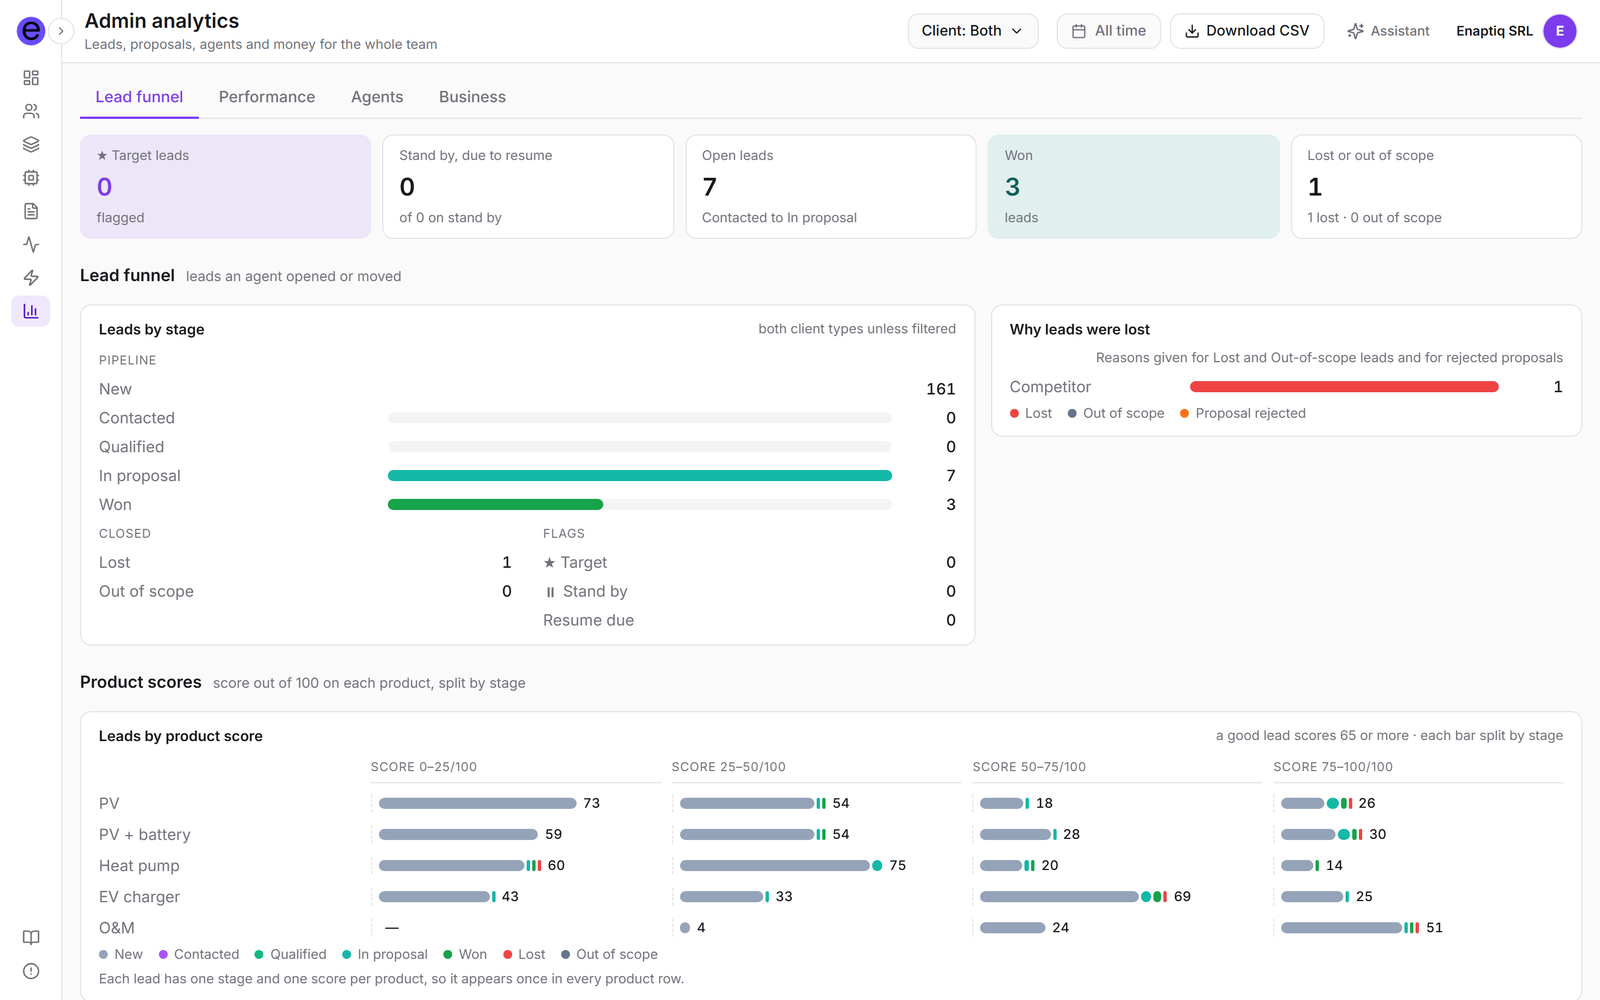
The lead funnel
Every lead by stage, from target to won or lost, and the reasons leads were lost.
-
02
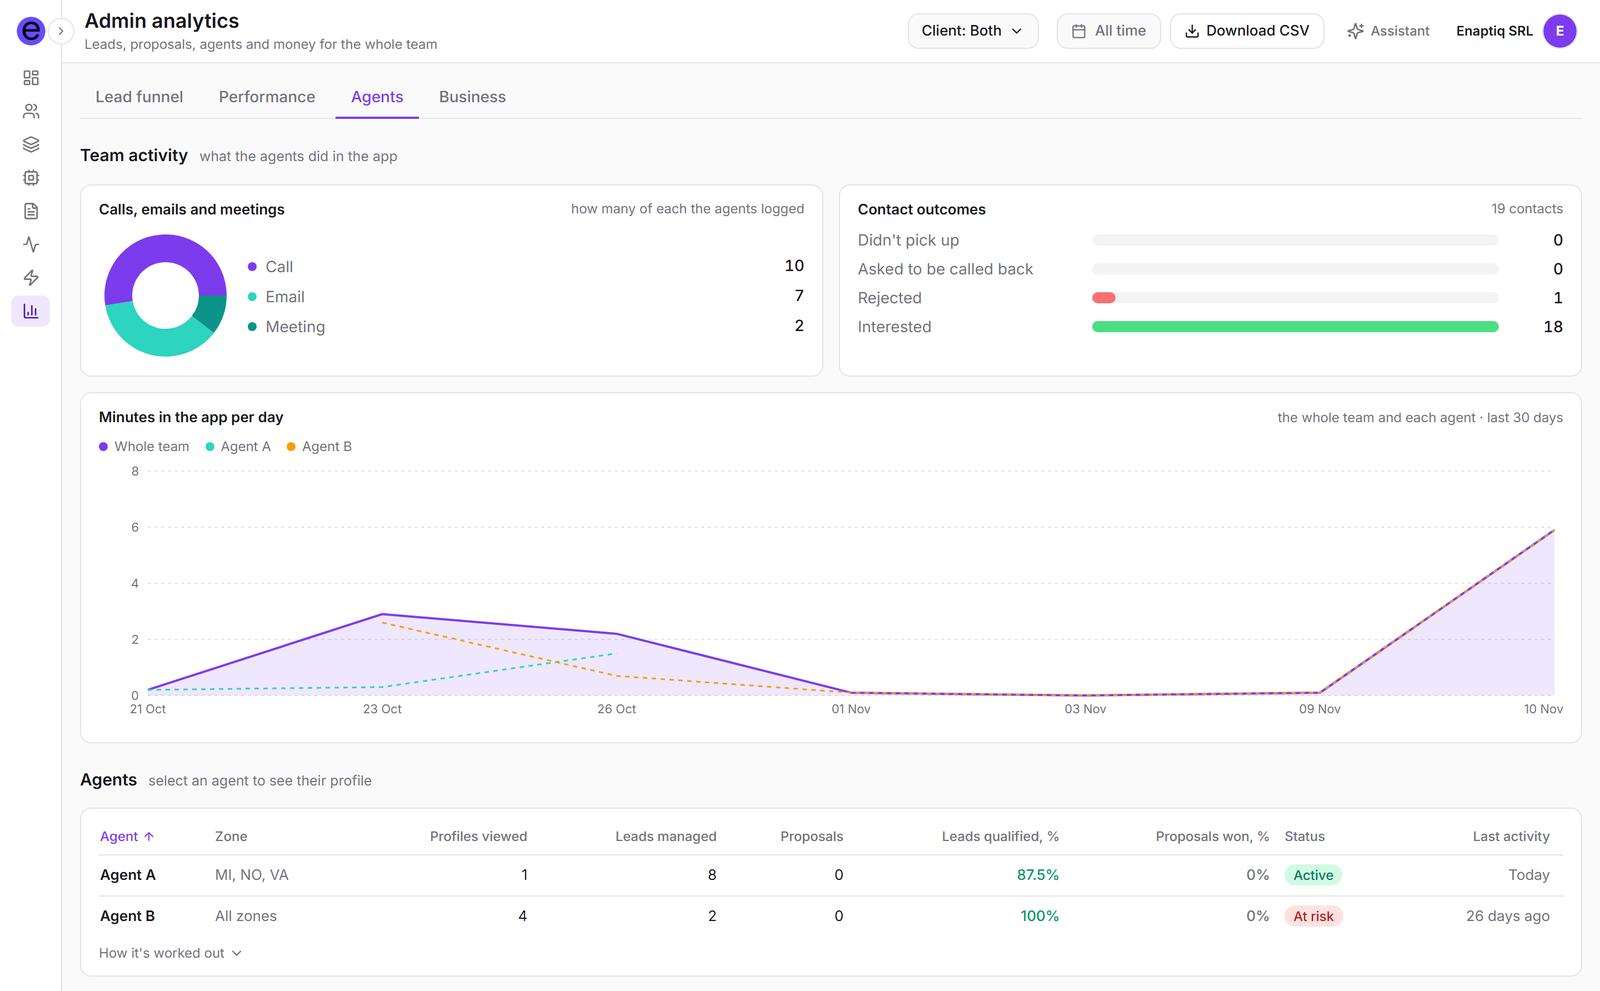
Each person's work
Calls, emails and meetings, contact outcomes, time in the app, leads managed, qualified and won, for each agent, with a drill-down per person.
-
03
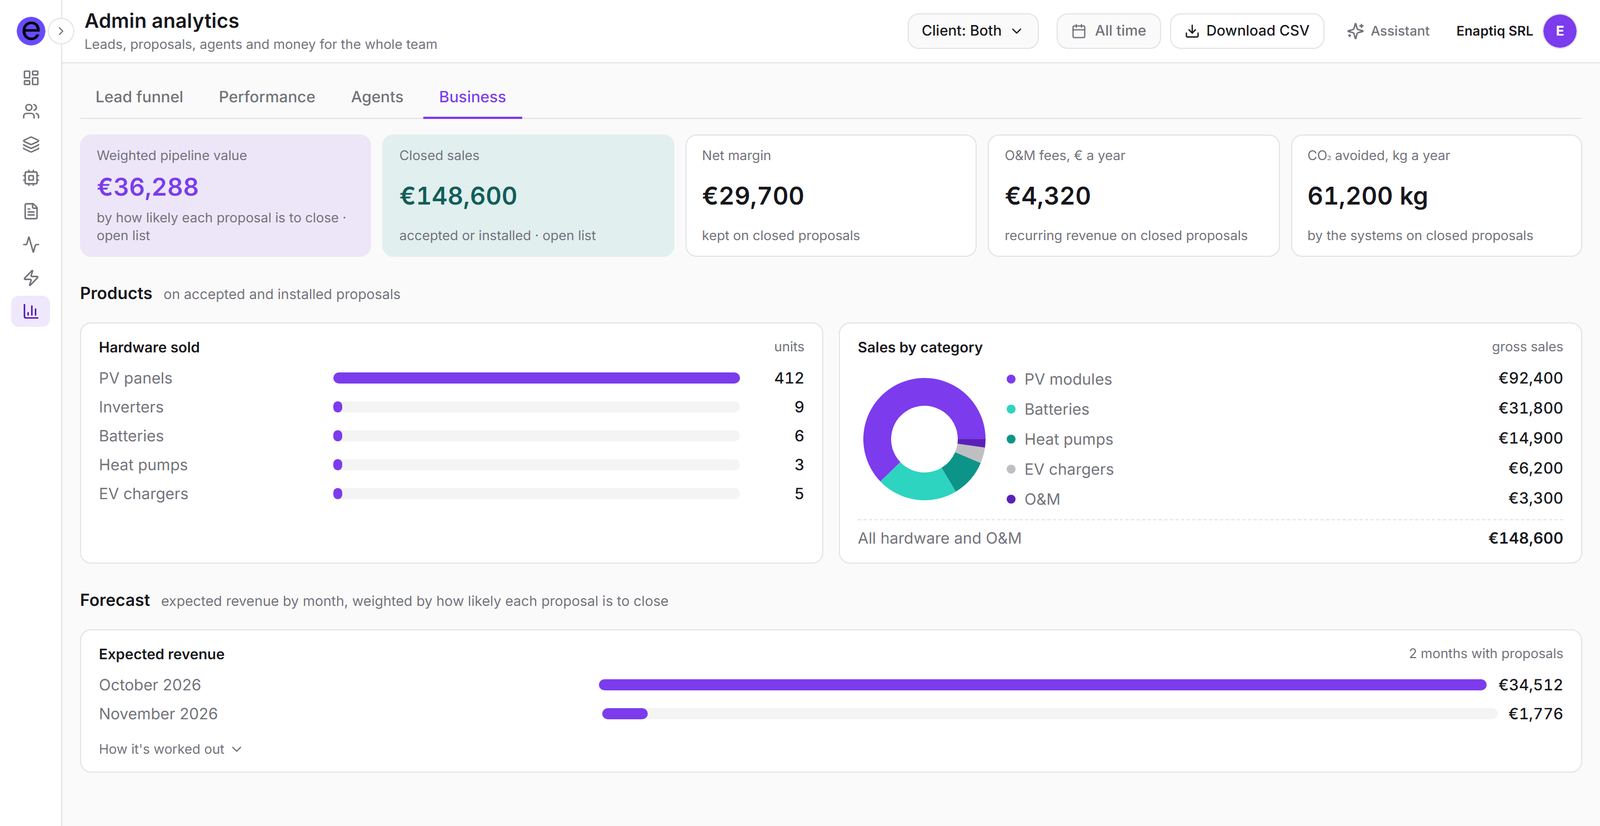
What the proposals are worth
The open pipeline, closed sales, margin, hardware sold, sales by category and the expected revenue ahead.
Watch the full flow.
Walk through the portfolio dashboard—customer base, lead rates, territory map and action queue—before opening Admin analytics. See the lead funnel by stage and loss reasons, sales speed and proposal status on Performance, and closed sales, weighted pipeline and monthly revenue forecast on Business.
What Enaptiq reads.
- Activity logged by the team: calls, emails, meetings, notes
- Lead stages
- Proposals and their status
- Products and margins
Your call, every time.
- Businesses, homes or both
- The period
- One agent's full profile
- Export to CSV
One view of who is doing what, where leads stall and what the pipeline is worth, without asking anyone for a report.

See it on your own customers.
Tell us what you want to sell and we'll show you this flow on your customer base.